2025 Benchmark Report
Comparative analysis of the performance of 87 websites in the cultural sector.
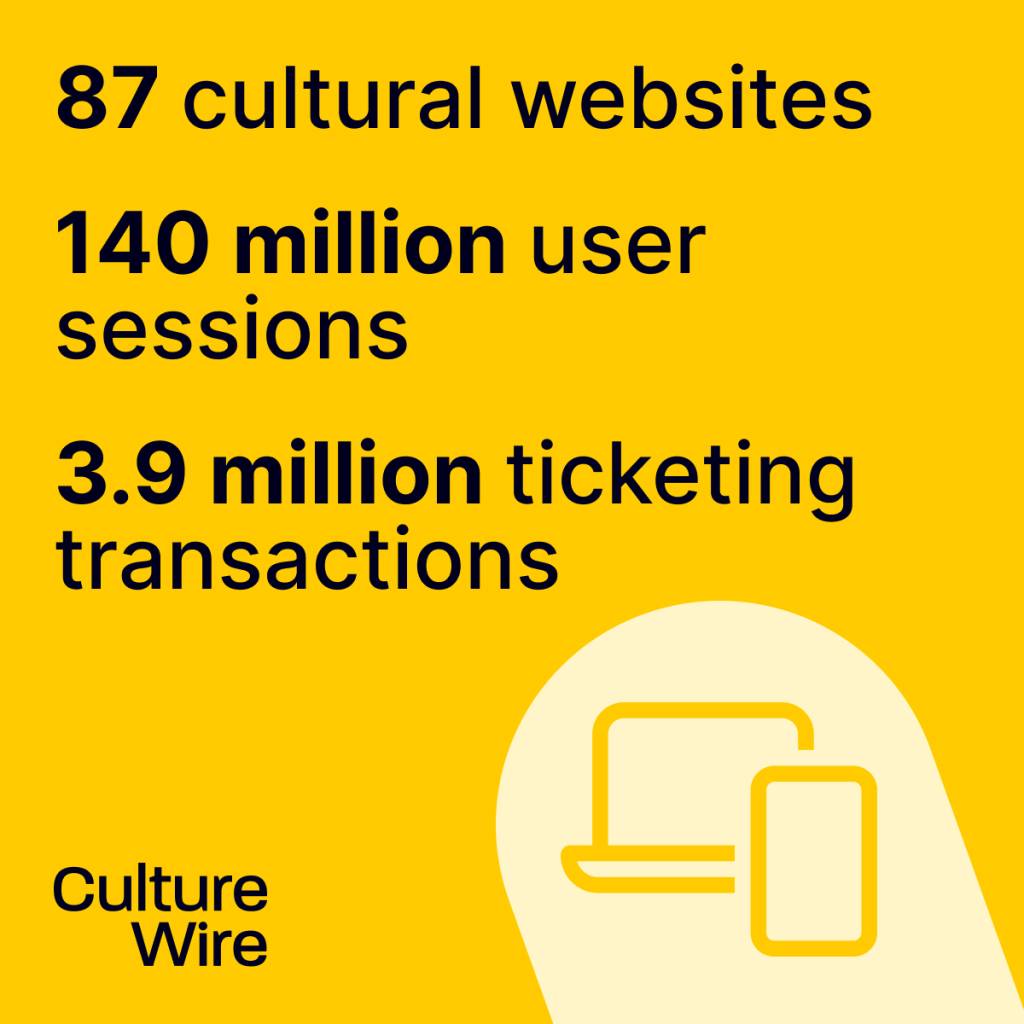
Welcome to our second annual Website Benchmark Report, where we have analysed the website data of 87 cultural organisations across the UK, Europe, and North America.
We’re privileged to work with a diverse range of arts and culture organisations, from theatres and dance companies to museums, galleries, opera companies, orchestras, and cultural visitor attractions. For each of these organisations, their website is one of the most vital audience touchpoints, and we’re often asked, “What does ‘good’ look like when it comes to website effectiveness?”
While general benchmarks are widely available, few focus on the unique needs and challenges of the cultural sector. To address this gap, we launched our first Cultural Website Benchmark Report last year, analysing data from 76 organisations across multiple art forms. The positive feedback we received highlighted how valuable comparative data can be when evaluating the performance of a website.
While your own historical data is crucial for tracking progress, benchmarking against the wider sector offers valuable context. This year we’ve taken the analysis further, examining over 140 million user sessions and 3.9 million ticketing transactions to uncover key trends in user behaviour and website performance.
Our research provides valuable insights to help shape your strategy, priorities and planning for your website. It also offers a broader view of industry trends and practices.
Our analysis and findings span five key areas:
- Traffic and device trends
- Acquisition channels
- Commercial performance (including donations and memberships)
- User behaviour
- Engagement
A few of our findings:
- On average, mobile devices are responsible for nearly 70% of traffic to cultural websites. But mobile conversion rates are on average 89% lower than desktop traffic.
- Your homepage is the entry point for just 19.6% of traffic to your website.
- A significant change in user behaviour from 2023 to 2024 is the increase in users landing on event pages. This has risen from 25% to 31.6%.
- The number of transactions on cultural websites has increased from 2.8m in 2023 to 3.9m in 2024.
- The average number of memberships sold has increased by 43.3%, with the largest increase in small organisations.
- Traffic from emails converts at a higher rate than any other source.
Six key takeaways:
Build with a mobile-first mindset
With mobile accounting for nearly 70% of sessions but suffering from lower conversion rates, it is vital to focus on enhancing the mobile user experience. This includes improving purchase paths and the checkout process, and ensuring it is simple to navigate and use your website on a device with a small screen.
Continue to improve your SEO strategy
Given that organic search is the largest traffic driver (and despite the increase in AI summaries in SERPs) investing in SEO remains crucial. Focus on optimising for non-branded keywords, improving structured data, and ensuring high-quality content to enhance visibility in search rankings.
Improve conversion on event pages
With a significant increase in users landing directly on event pages (32% overall), these pages should be designed for maximum conversions. Key actions include making CTAs clearer, ensuring ticket purchase options are prominent, and improving accessibility.
Review any basket abandonment issues
It is important to keep a close eye on basket abandonment rate, since an increase could indicate friction in the checkout process. Consider running some user testing to identify any friction points and consider all elements of the experience, including aspects such as making in-basket messages clearer.
Capitalise on online memberships sales growth
The increase in online membership sales (+43.29% year-on-year) suggests a growing opportunity. You may want to review your membership offer and reconsider how you present it online – throughout key points in the user journey. For example by emphasising exclusive benefits and highlighting discounts within the purchase journey to encourage sign-ups.
Refine your content engagement strategy
While overall engagement rates have improved, video interaction remains low. You may want to test different formats, experiment with short-form videos, and ensure content is well-placed to attract user interaction.
If you’re looking to analyse the impact of your website or need tips for optimising performance, just get in touch – we’d love to chat!
Related work